

This blog post is part of a series of blogs designed to help a business understand the interaction between Dynamics GP and Power BI, how to setup Power BI with Dynamics GP and what some of the options are for this functionality. This write up was done using Dynamics GP 2018.
To view the full list of the series, click here.
How to resolve the error:
Unable to connect to the PowerBI Site. Contact your system administrator.
So, you’ve done all the setup and you are ready to get Power BI on your GP Dashboard but when entering into the home screen customization window, you get a blank screen with a very misleading message… Unable to connect to the Power BI site. Contact your system administrator.
Kristen Hosman reached out to me with this roadblock, and I’m glad she did! I wasn’t sure how to fix this but we figured it out and I am happy to share the solution with my readers!

Immediately I thought this was a connection or security issue. Why did I think that? Well, the message indicates that it can’t connect silly 🙂 But, after some testing, it wasn’t a connection issue after all – well, for the most part, let me explain. Even though the Power BI account was functional, connected, and had reports… Dynamics GP couldn’t connect to one very important thing… A dashboard! No problem! Let’s take a look at how to fix this.

Dynamics GP connects and surfaces your dashboards first… so without one, it doesn’t recognize any of your reports.
Not a problem at all! To fix this, just login to Power BI and open up any of your reports. Here is one of my page of reports.. I have a few reports there but let’s just add one for now to see if we can get past this error. Notice the pin in the image below… I’m going to use this to add this KPI to my dashboard.

Once I click the pin, a new window opens up asking me which dashboard I want to use… well, I don’t have any to select (hence the error in the first place) but what is nice is that I can create a new dashboard on the fly!

So I gave it a name and selected ‘Pin’. This did two things – created the new dashboard and added the object to that new dashboard.

EXCELLENT!!! Now let’s head back into GP (no need to restart) and reopen the Power BI Details window (customize this page/Power BI).
WELL LOOK AT THAT!!! SWEET!! No more error and now our dashboard is showing!

Just expand the dashboards option, select your new dashboard and pick the report you want to move over into the ‘Selected Reports’ area.
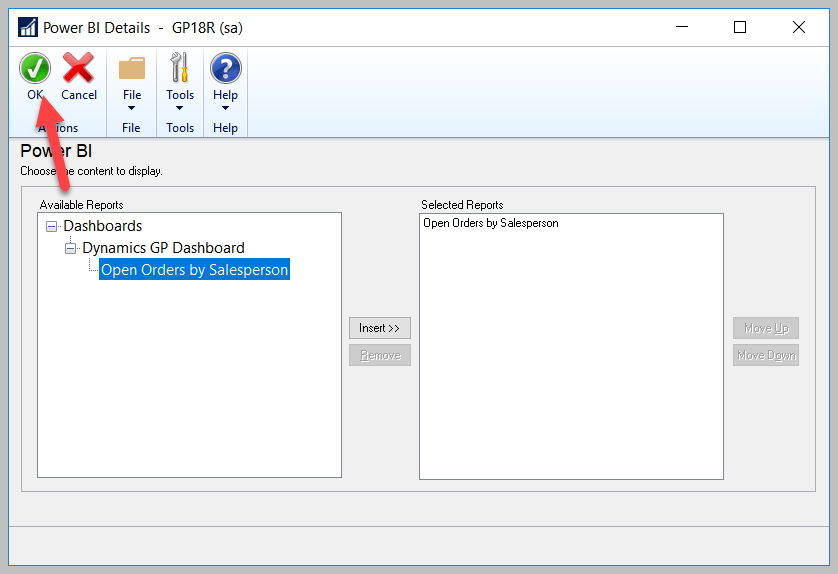
In my example, it’s just one, but you can move more than that if you have more reports pinned on your dashboard! Hit OK and that’s it! Now we have Power BI on our GP home screen! Isn’t that BEAUTIFUL!!! 🙂

There may be other reasons you receive this error – if you have experienced this and this blog doesn’t help – let me know below so we can try to figure it out together!
Thanks again to Kristen for reaching out about this error! She is back in business with Microsoft Dynamics GP and Power BI – I hope you are too!
Thanks for reading!
Shawn
Shawn Dorward
Microsoft MVP, Business Solutions
LifeHacks365.com | LinkedIn | Twitter | GPUG | MSDYNGP
Original Post: https://lifehacks365.com/2018/06/08/dynamics-gp-power-bi-unable-to-connect-to-powerbi-site-contact-your-system-administrator/